← PROJECTS · 02
H₂Acceptance testing of 700 bar dispensers to EN 17127
Delivered as engineer at a national H₂ network operator.
RESULT
Evaluation went from hours of manual chart work to minutes per test, in one defensible format.
THE CHALLENGE
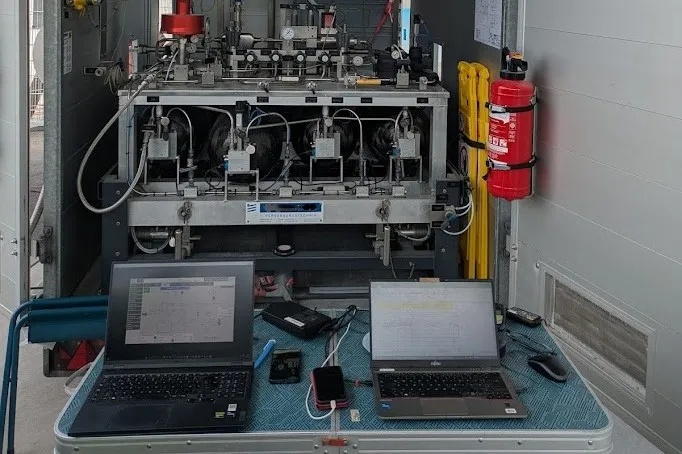
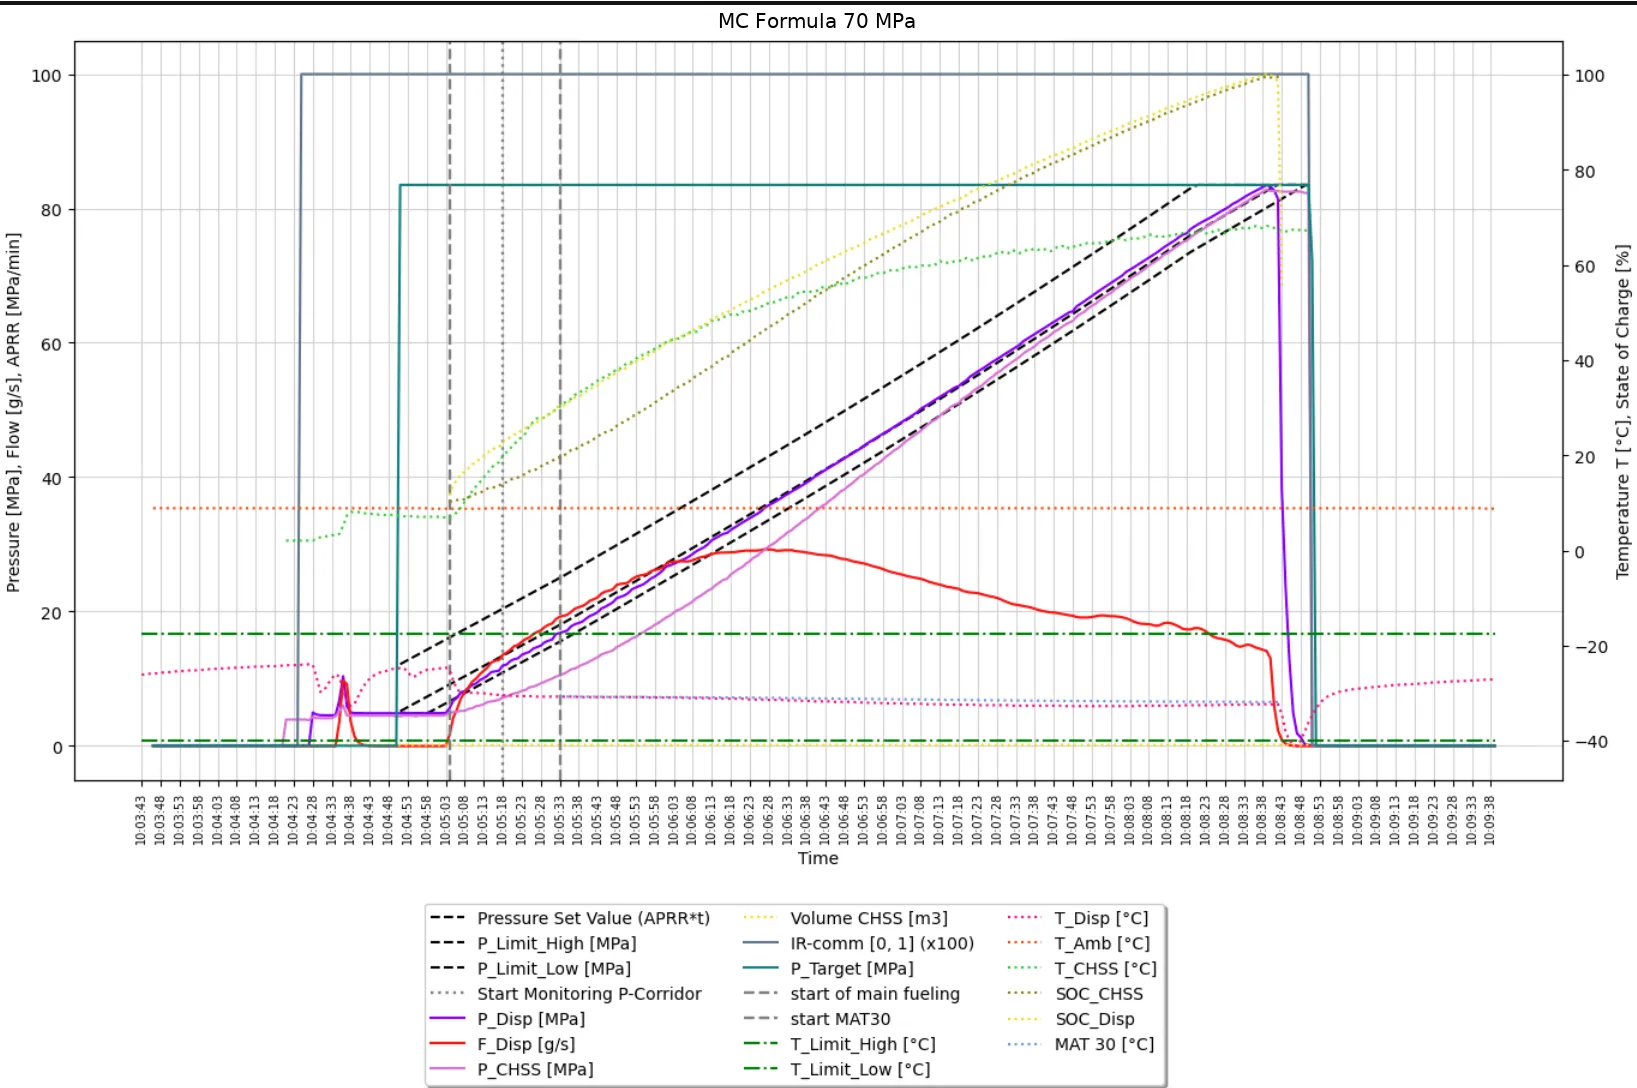
Before a station goes live, its dispensers must prove in FAT/SAT tests that every fill stays inside the EN 17127 / SAE J2601 pressure and temperature corridors. One test produces 20+ simultaneous sensor traces, and the evidence must hold up before manufacturer, operator and notified body at once.
Evaluating those traces by hand, test after test, was slow, error-prone and inconsistent: exactly what acceptance disputes feed on.
WHAT I BUILT
I built an automated analysis pipeline in Python: it ingests the raw test logs, reconstructs the target pressure ramp (APRR), overlays corridors, MAT30, state of charge and flow, and renders a standardized chart plus pass/fail per criterion.
The same tooling derived PLC limits from thermodynamic boundary conditions and pinpointed which subsystem (precooling, compressor staging, communication) caused a corridor violation.
WHAT CHANGED
Violations became diagnosable: the chart shows which subsystem pushed the fill out of bounds.
Dozens of acceptance tests supported across multiple stations and dispenser generations.